- Jon Hellevig
- September 2, 2019
- 5600
Purchasing Power Parity Adjustments (PPP)
In order to properly understand the importance of the PPP method, we start by republishing here an article we earlier wrote on the topic under the heading Why the PPP method is more accurate for GDP comparisons.[1]
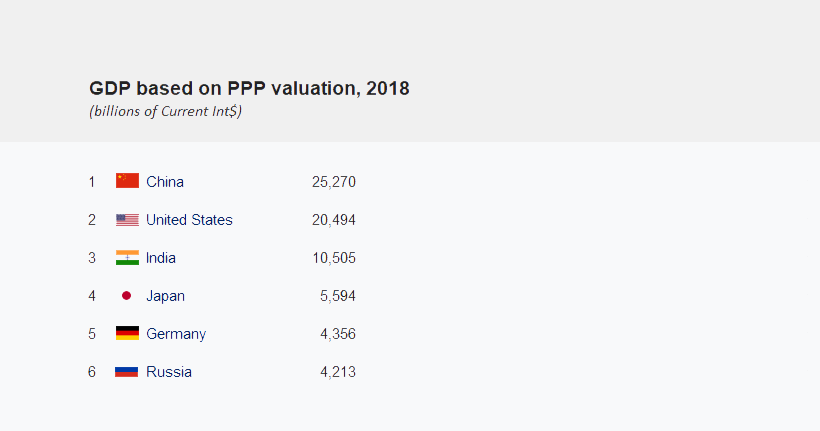
According to figures from the IMF, Russia’s GDP exceeded $4.2 trillion in 2018. By this measure, Russia is the 6th largest economy in the world, virtually on par with Germany, who scored $4.35 trillion.
At the same time, China has solidified its position as the world’s indisputably largest economy. With its $25.27 trillion, China’s economy is already bigger 1/5th than the U.S. economy with its $20.49 trillion.

These GDP figures are calculated according to the PPP method. PPP stands for purchasing power parity and it aims to capture the value of the real economic output contrary to the method of rendering GDP in nominal USD figures. The nominal method, converts a country’s GDP calculated in the local currency to the USD using the market exchange rates. The figures calculated with the nominal method is what the media tends to report. But, the Nominal GDP method contains several grave errors. There is a huge calculation bias in favor of the countries possessing the dominant world currencies, that is, the Western countries. Thanks to the dominant currencies, their GDPs tend to be inflated in value as compared with the countries with currencies that are not widely used globally. This way, the economies of the Western countries would seem bigger than they are if one only goes by the nominal market exchange value.
High taxes and a high general level of prices also push up the nominal GDP, again making the Western economies seem bigger than they are.
GDP is statistics fraught with assumptions
Before we proceed further, we must note that any GDP (Gross Domestic Product) calculation is a statistical exercise based on a host of assumptions on how to arrive to the total value of everything produced. Therefore, the step from Nominal GDP to PPP method is just one of the thousands of assumptions, the one method is not based on more exact input data than the other.
The volume of the economy is expressed in a monetary form, because that is the only way you can make all the millions of products statistically comparable, but what we really need to know is how much of each product has been produced, how many cars, how many houses, how many tomatoes etc. But, by using the USD exchange rate as the multiplier we lose the comparability. (Global GDP comparisons are always given in USD).
If one kilo of tomatoes costs 90 rubles or 1.5 USD in Russia and 4.5 USD in the United States, then according to the Nominal method the U.S. economy would be 3 times bigger by this parameter, even though both countries would produce the same amount of tomatoes. In fact, on average, almost everything is 3 or 4 times less expensive in Russia, therefore, by converting the Russian prices to USD according by the market exchange rate, Russia’s economy would seem 3 to 4 times smaller than it actually is. This is where the PPP method comes in to remove the calculation biases and currency fluctuations. The PPP method looks beyond the US dollar, striving to capture the actual volume of goods and services produced in a country. In comparing the size of the economy of different countries, that is precisely what we want to do, to measure their real output of goods and services.
The PPP method adjusts the dollar GDP to the comparative price levels
The starting point for the PPP GDP is the Nominal GDP calculated in the local currency of any country. This is then adjusted by the PPP coefficient, which is the average price difference between products in the given country and the U.S. The local GDP figure is multiplied with the PPP coefficient and this way we reach the more accurate comparison of the actual volumes of the economies. We are still using the USD as the currency for comparing all the world’s economies, but have adjusted them to eliminate the market exchange rate biases.
Another way to express this is to say that we check how much of any given product we can by for one dollar in various countries. Any expat and even tourist experiences something similar on a daily basis when they are in a foreign country, observing what their money buys there compared with at home. The so-called Big Mac index, which compares the price of McDonald’s Big Mac sandwich around the world can serve to illustrate the differences in price levels of various countries. (The idea being that as the product and the production method is highly standardized, it would tell something about the general price level differences). In the U.S. a Big Mac costs on average 5 dollars, while the price in Russia is 2 dollars. Thus by this indicator alone the Russian economy would look artificially lower by 2.5 times using the Nominal method and its market exchange rate. (In reality McDonald’s prices are not the best indicator, because the prices are still higher than the general level of prices due to McDonald’s brand dominance, franchising royalties etc.)
Quality of products is not the explainer
The adherents to the Nominal GDP method maintain that what explains the price difference is supposedly quality, a better Western product is more expensive because it is of better quality, they say. Obviously, quality affects the comparative prices, but only to a certain degree, and often not at all. Let’s go back to the example of tomatoes, many claim – and I agree – that tomatoes in Russia, as well as vegetables in general, are often tastier than those in Europe, yet they are cheaper, so for sure quality is not what explains the price difference in these cases. Or how about a haircut? I can get it for 3 dollars in Moscow and 20 in Helsinki, and really there is no difference in the result.
The PPP method thus assesses the actual economic output of goods and services disregarding the distortions of currency exchange rates and all the structural differences on the markets of the various countries, contrary to the wrongheaded nominal GDP method.
In the case of Russia, a particularly good example is the arms industry. Lately, it has been proven beyond any doubt that Russia’s weapons, aircraft, missile systems, tanks etc. are by no means inferior in quality to the American ones, yet they cost much less. This article[2] argues that the PPP difference in the arms industry could be as high as tenfold in Russia’s favor.
The final nail in the coffer of the Nominal GDP method
I often find myself in online arguments with Nominal GDP apologists, where I go through all these arguments and many more. But, they just go on and on, till we come to the final argument that would shut them up – literally. I tell them that Russia’s nominal GDP in 2016 was $1.28 trillion and it is expected to reach $1.47 trillion by 2017. That’s a 14.5% growth, I point out, and then I ask them to explain how Russia has reached this absolutely spectacular growth. “That’s not real growth, it’s just the exchange rate difference when the ruble appreciated,” they frown. – Exactly, that’s what it is. That’s what the Nominal GDP is, an illusion based on fluctuating and biased exchange rates.
PPP and tax adjusted income, Russia compared with Finland
As it was shown, a proper comparison of income levels between countries would have to consider both the difference in price levels (PPP adjustments) and the tax burden, so that income would be compared net of taxes and adjusted to the respective price levels. Both these adjustment vastly favor Russia, in the sense that it shows Russia’s true comparative wealth and well-being. This point is well illustrated by comparing the adjusted salaries of Russia and Finland.
The nominal gross average monthly salary in Russia of $775[3] – pales – at a superficial glance – in comparison to the $3,730 of Finland.[4] But after a 30.4% tax, the salary in Finland would be worth $2,700[5] whereas in Russia $687 would be left after a 13% flat tax. The PPP conversion factor between the price levels in Finland and Russia is 2.68, meaning that prices in general and on average are 268% higher in Finland.[6] Therefore, we must multiply the Russian net salary by 2.68 to make it comparative with the Finnish. This gives $1,840. Alternatively, we could divide the Finish salary by the PPP factor to compare it downwards with the Russian salary, yielding $1,000. In the latter case we would see that the $3,730 which seemed to be a vastly higher salary in Finland in actual reality is worth $1,000 (in the home country) compared with the actual value of $687 of the Russian nominal gross salary of $775.
In April 2018, the average salary in Moscow was 89,000 rubles, the equivalent of $1,465. Making the same adjustments as above, this would yield the purchasing power comparable value with Finland of $3,410. In Finland you would have to earn $6,500 to achieve the same purchasing power as the Moscow $1,465.
Net of tax and adjusted for purchasing power, a monthly salary of $3,700 in Finland equals a salary of $1,150 in Russia.
The above examples should make it clear how illusional the nominal income and nominal wealth comparisons are if they are not adjusted for purchasing power parity and indeed taxes, too. For further reading, we refer to Awara Global Survey on Total Payroll Taxes 2014[7]
[1] Jon Hellevig at Awara Accounting blog https://www.awaragroup.com/blog/despite-sanctions-russias-gdp-shoots-over-4-trillion/
[2] http://russia-insider.com/en/russia-and-china-will-win-new-arms-race/ri13258
[3] Rosstat gives $674 for 2017, we have adjusted that with the income paid in the shadow sector, as explained in this report
[4] Data from 2016 https://yle.fi/uutiset/3-9843295
[5] We refer to the calculations of the Finnish Taxpayers Association of effective tax for various income levels https://www.veronmaksajat.fi/luvut/Laskelmat/Palkansaajan-veroprosentit/
[6] The PPP conversion factor is calculated by comparing the nominal GDP and PPP GDP as reported by the IMF
[7] Jon Hellevig at Awara Accounting blog https://www.awaragroup.com/blog/survey-on-total-pay-roll-taxes-2014/


